
Nagios is a host and service monitor designed to inform you of network problems before your clients, end-users or managers do. It has been designed to run under the Linux operating system. The monitoring daemon runs intermittent checks on hosts and services you specify using external “plugins” which return status information to Nagios. When problems are encountered, the daemon can send notifications out to administrative contacts.Current status information, historical logs, and reports can all be accessed via a web browser.
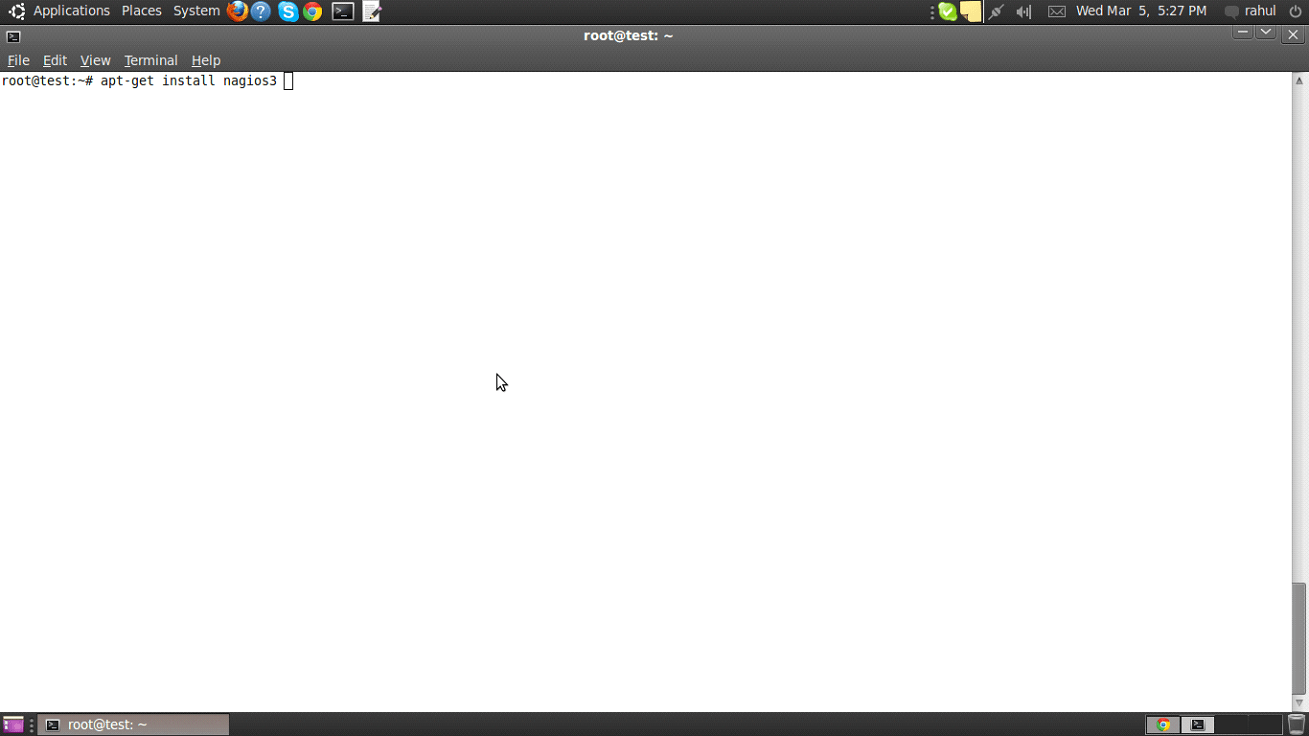
Naigos can be installed with the following command in ubuntu
“apt-get install nagios3”
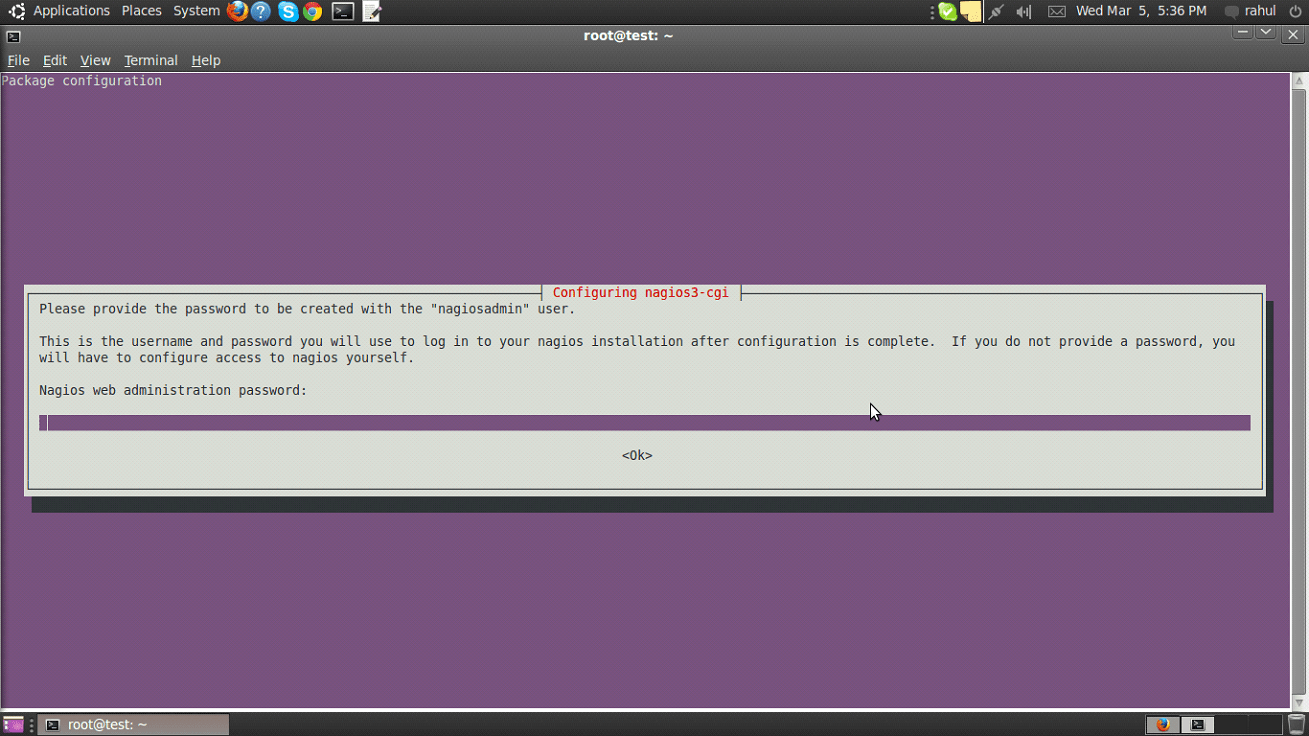
Enter the nagiosadmin password and complete the installation process.
There are a couple of directories containing Nagios configuration and check files.
-
/etc/nagios3: contains configuration files for the operation of the nagios daemon, CGI files, hosts, etc.
-
/etc/nagios-plugins: houses configuration files for the service checks.
-
/etc/nagios: on the remote host contains the nagios-nrpe-server configuration files.
-
/usr/lib/nagios/plugins/: where the check binaries are stored. To see the options of a check use the -h option.
For example: /usr/lib/nagios/plugins/check_dhcp -h
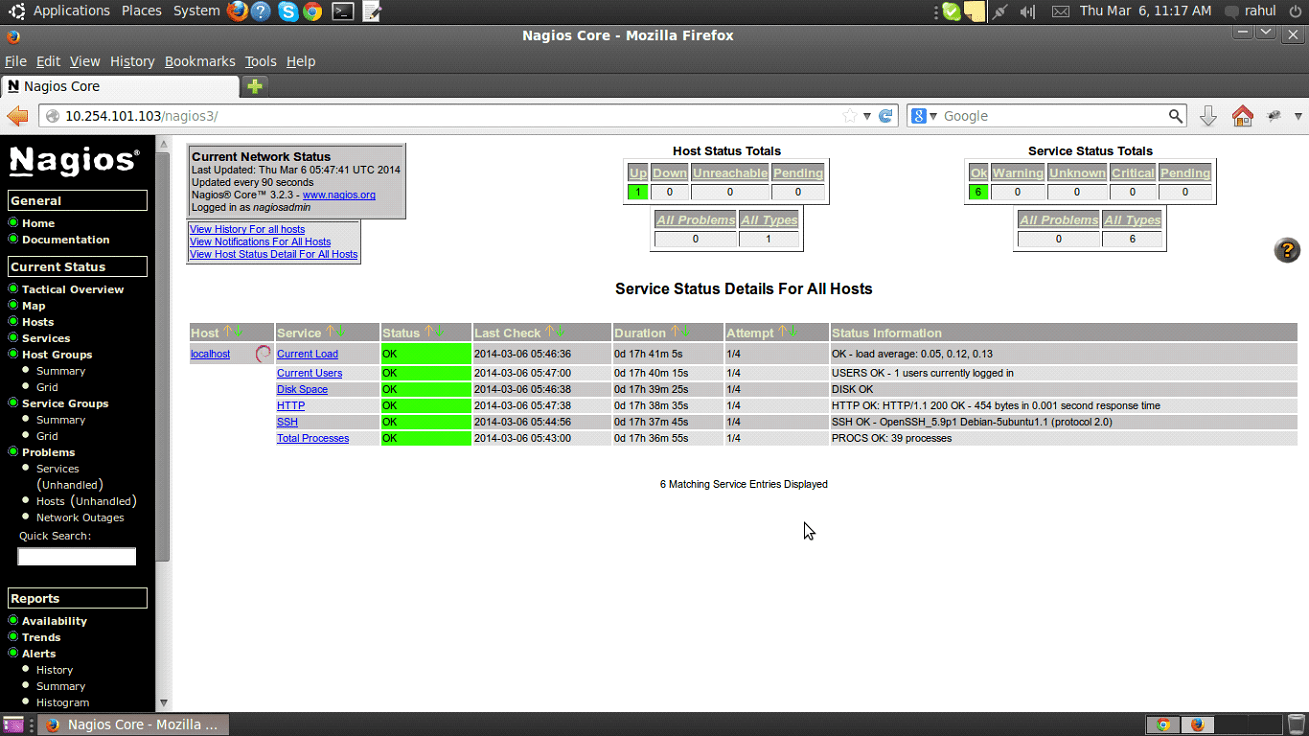
After successful installation, there will be a localhost.cfg file in /etc/nagios3/ that will be monitoring disk space, number of user etc, in the system. It can be viewed by logging into the web interface of nagios.The following url can be used to log in to nagios web interface, the user name will be nagiosadmin and the password is the one entered during installation
http://ip-of-server/nagios3
Configuring Nagios for checking processes that need to be monitored.
/usr/lib/nagios/plugins contains binaries which can be used to for figuring out process checks.
For example:
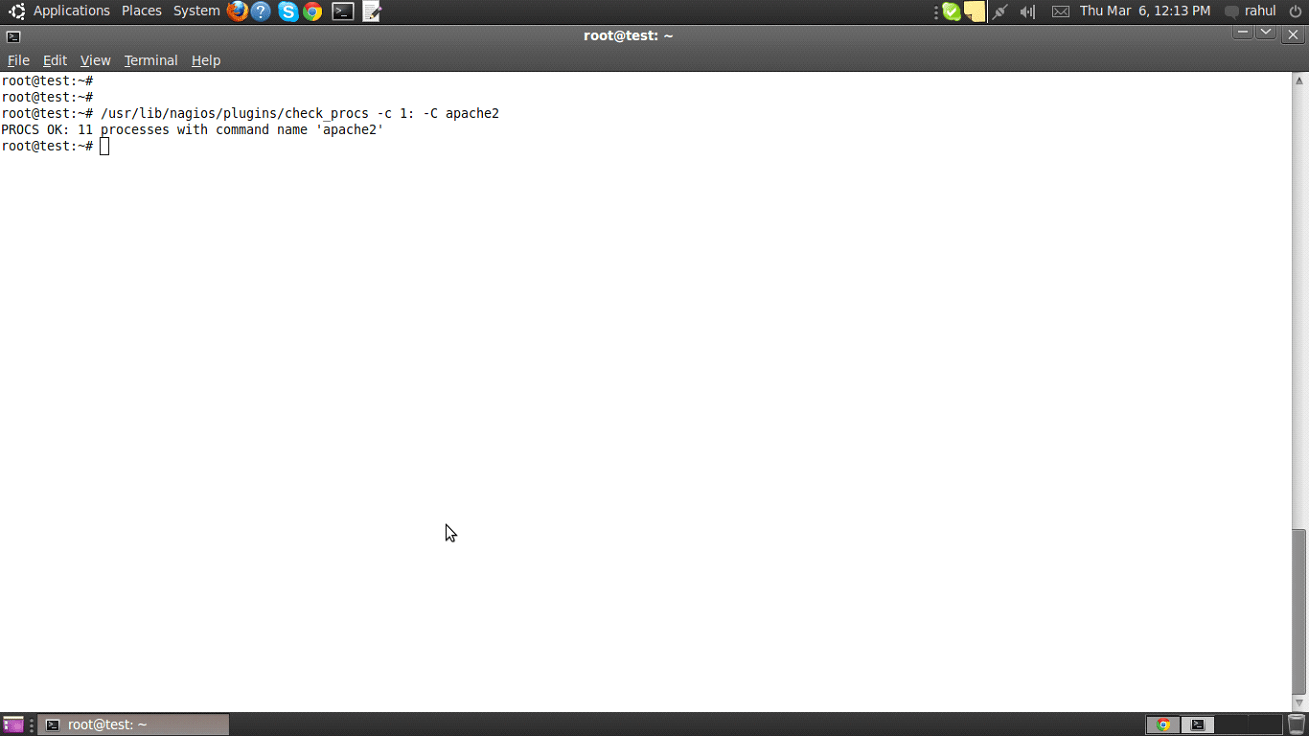
Here is how to check if “apache” is running or not
/usr/lib/nagios/plugins/check_procs -c 1: -C apache2
In the above command
-c = Generate critical state if metric is outside this range-C = Only scan for exact matches of COMMAND
Here is another example to check CPU: nagios will indicate warning if the % cpu utilized by any process is greater than 70% and will indicate critical alert if the % cpu is greater that 80%
/usr/lib/nagios/plugins/check_procs -w 70 -c 80 -m CPU -t 20
In the above command,
-w = Generate warning state if metric is outside this range
-c = Generate critical state if metric is outside this range
-m = Check thresholds against metric
-t = Seconds before connection times out
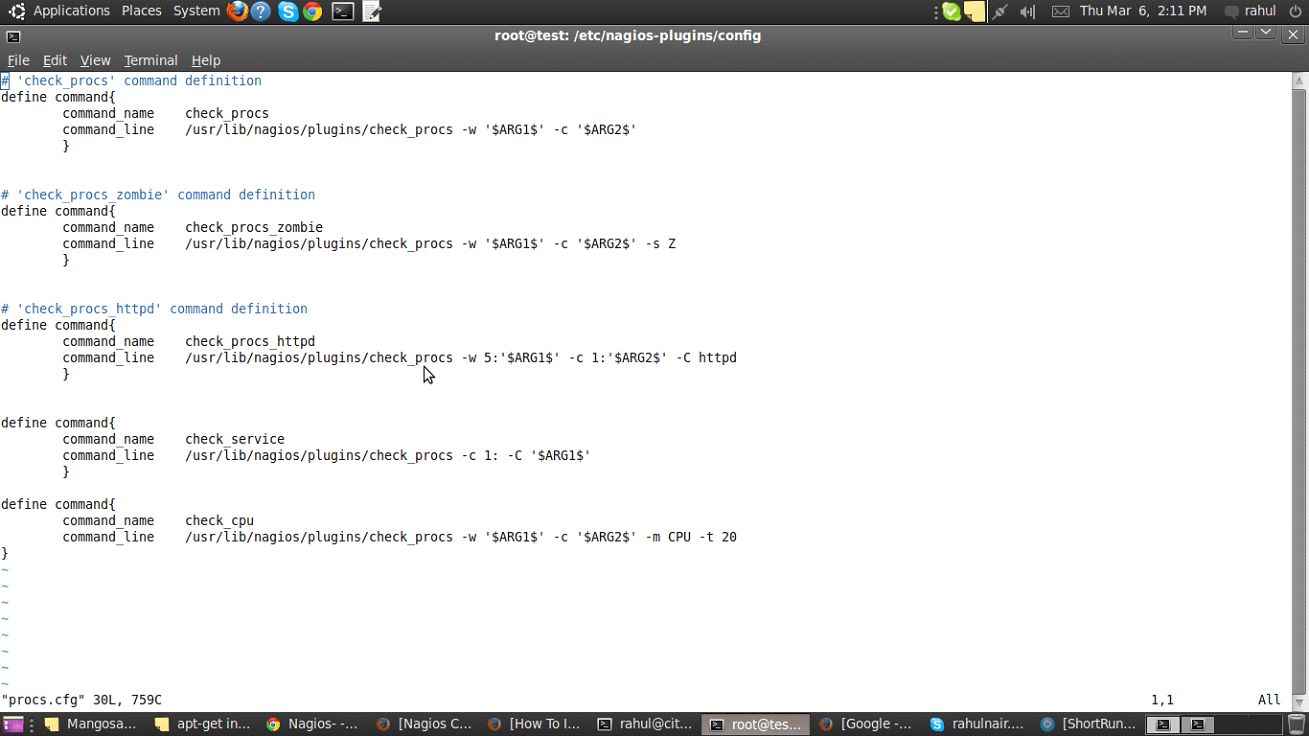
Once the process checks are figured out , it will be added to /etc/nagios-plugin/config . The above defined commands are updated accordingly in the file
For example
Edit proc.cfg(in this case) in /etc/nagios-plugin/config to define a customized command and add the following for the process check we described above. Save proc.cfg.
define command{
command_name check_service
command_line /usr/lib/nagios/plugins/check_procs -c 1: -C ‘$ARG1$’
}
define command{
command_name check_cpu
command_line /usr/lib/nagios/plugins/check_procs -w ‘$ARG1$’ -c ‘$ARG2$’ -m CPU -t 20
}
$ARGx$ indicates the arguments that we pass for checking using the command_name
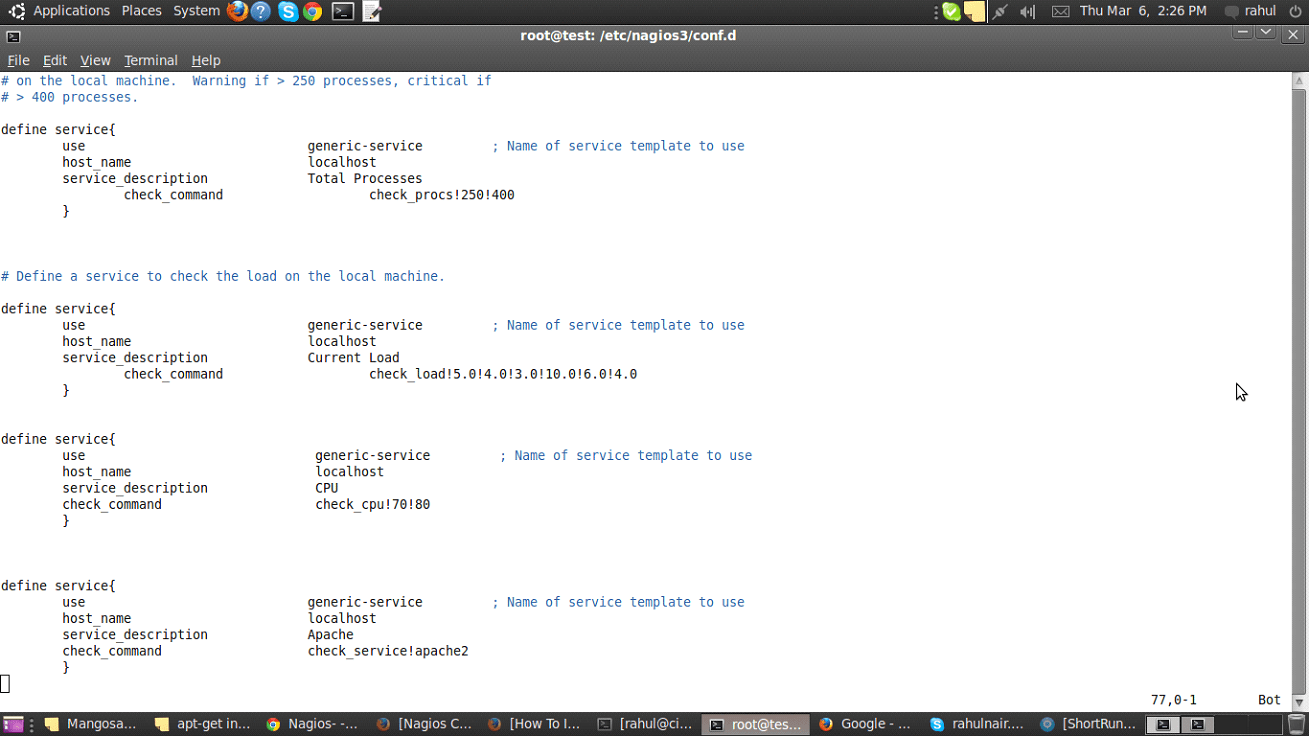
Once the customised commands are updated in the /etc/nagios-plugin/config, edit /etc/nagios3/config/localhost.cfg and create check for the processes.
Add the following lines in localhost.cfg for checking apache and cpu
define service{
use generic-service ; Name of service template to use
host_name localhost
service_description CPU
check_command check_cpu!70!80
}
define service{
use generic-service ; Name of service template to use
host_name localhost
service_description Apache
check_command check_service!apache2
}
Save the file and restart nagios.
Nagios can be restarted using the following command
/etc/init.d/nagios3 restart
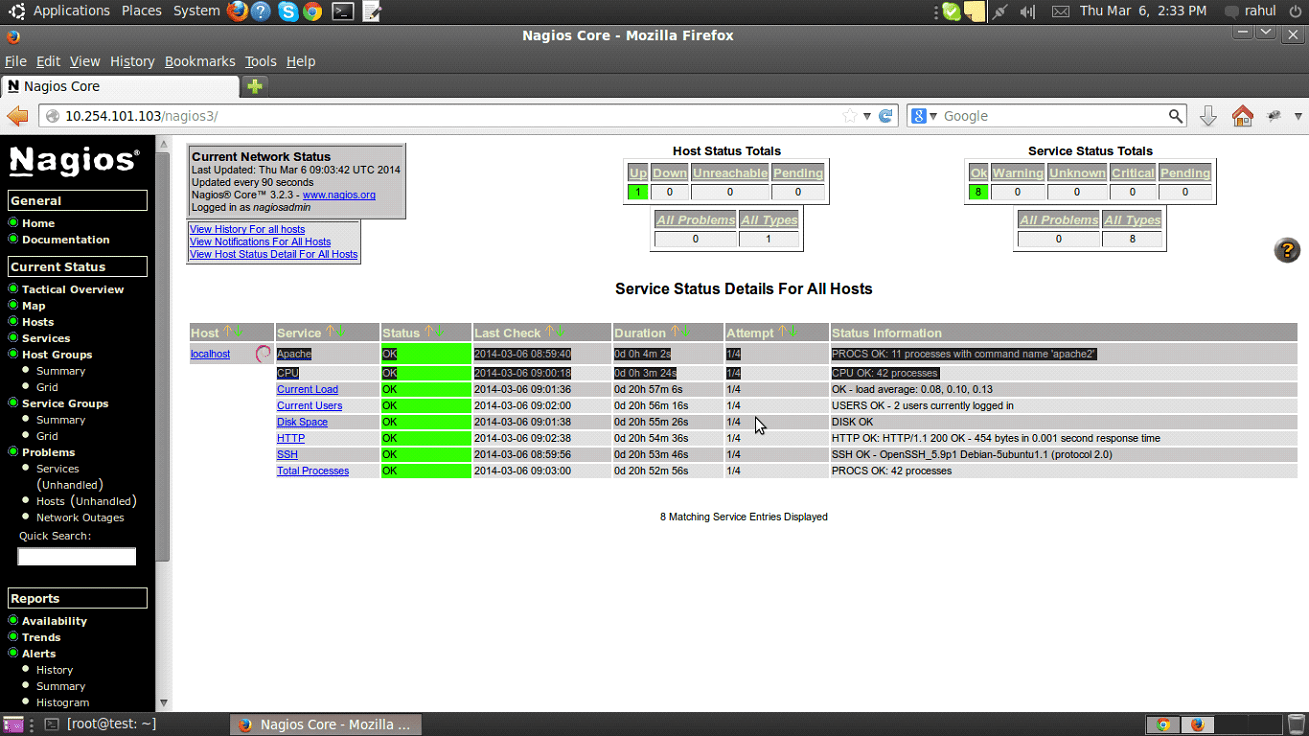
Once we opt nagios for restart, the above process checks will be shown in the web interface
Configuring Nagios to send email notifications
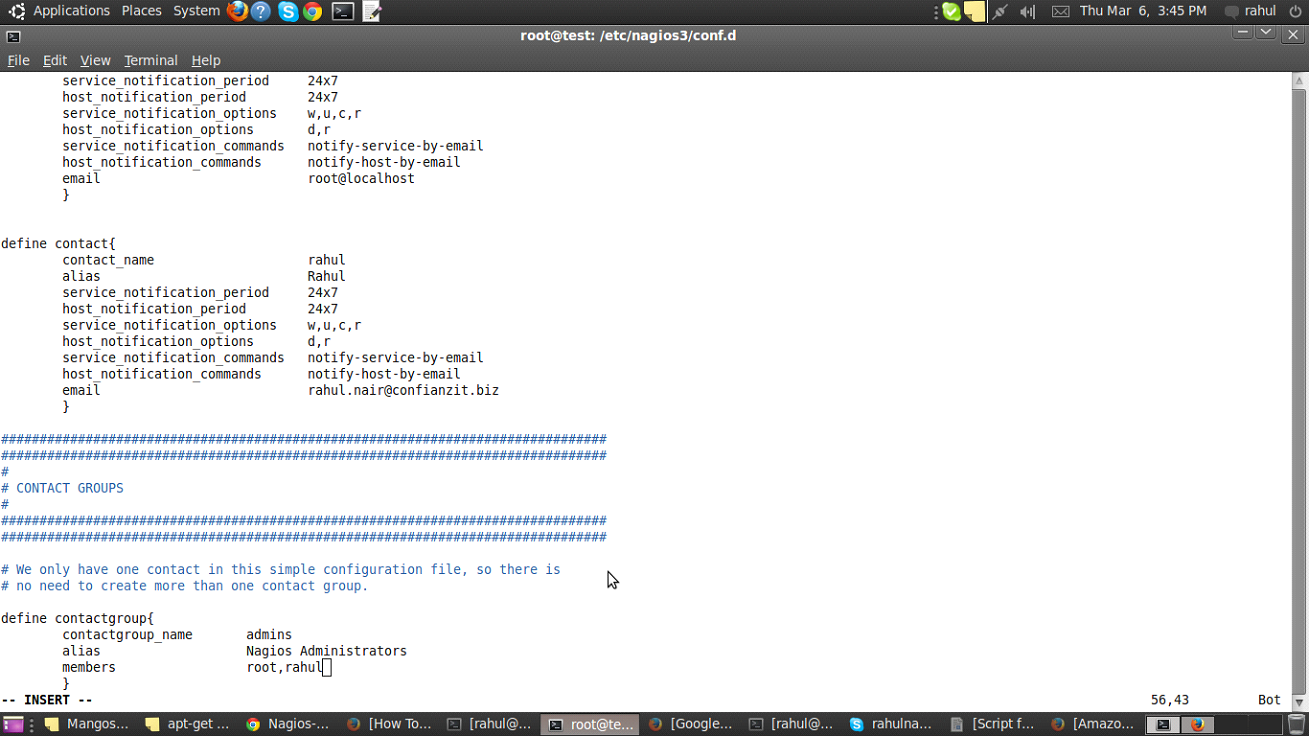
Edit /etc/nagios3/conf.d/contact.cfg to add a contact and define it contact group. Restart Nagios
For example
define contact{
contact_name rahul
alias Rahul
service_notification_period 24×7
host_notification_period 24×7
service_notification_options w,u,c,r
host_notification_options d,r
service_notification_commands notify-service-by-email
host_notification_commands notify-host-by-email
email [email protected]
}
define contactgroup{
contactgroup_name admins
alias Nagios Administrators
members rahul
}